Feb 23, 2014

Conducting a Distance Azimuth Survey

Introduction

Figure 1 - This is a laser distance finder.
There is a second smaller component
not shown here that is placed at the
destination object.  This portion gets
pointed directly at the smaller component
and then the laser reads how far away the
two components are from each other.
     Survey data can be useful for many different applications and there are many different ways that surveys can be done.  Recent technology can allow you to acquire very accurate readings about objects' locations, but they also have their share of problems.  Technology does not always work correctly, therefore it is important to know traditional methods of survey.  For this exercise, the groups were required to use hand instruments to conduct a field survey of a quarter hectare to a hectare area of interest.  The members of our group learned how to you an azimuth compass (Figure 2), a laser distance finder (Figure 2), and a TruPulse Laser (seen in Figure 3) that measures both distance and azimuth during the in class demonstration on February 17, 2014.  To survey our study area, we decided to only use the TruPulse Laser.  We decided to take these points around Governor's Hall on upper campus at the University of Wisconsin-Eau Claire.  We decided to take laser points at three different locations and took data points of trees, snowmen, snow piles, picnic tables, light poles, electrical boxes, doorknobs, frisbee golfing holes and signs, and other various signs.  We conducted our survey on February 21, 2014, which was the day after Eau Claire experienced blizzard like conditions and accumulated an extra 10 inches (minimum) of snow.  Cody is shown below to try to demonstrate how deep the snow was (in Figure 4).  
Figure 2 - This is an azimuth compass.  To give an azimuth reading, hold the device up to your
eye and point it at the destination object.  Keep both eyes open so you can see the object in question.
The compass will show an azimuth reading inside.
Figure 3 - This is the field equipment used to conduct the survey.
The main instrument we used was the TruPuse Laser distance
 finder, which is labelled with "RW" in this photo.
Figure 4 - Here is Cody cold and miserable while demonstrating
 how deep the snow was on the day the survey was conducted.
This provided a good challenge for our survey.

The members of my group were the same as the previous lab: Cody Kroening and Blake Johnson.

Methods

Data Collecting

     Before even going out in to the field, we checked to see what the magnetic declination was for Eau Claire, WI.  Magnetic north is different from true directional north.  The declination is the difference between magnetic north and true north.  This is needed because the devices can have the declination set on them.  Also before going out into the field, we needed to set up a geodatabase for this exercise.  This helps organize the data, especially once tool from ArcToolbox start to be used.
     When thinking about a study area, we were thinking of a place that would have many features that we could take point data on.  We decided to do our survey around Governor's Hall because there are many trees to take point data on (general map shown by Figure 5).  Also, with the influx of snow, there were large snow piles from plowing the roads and sidewalks, and some of the students had also made snowmen and snow forts that could act as points in our survey.
Figure 5- This is a general map of Eau Claire.  The UWEC campus is in the center of this map.  The red star represents a view of where our study area is in context with the city.
 The first location of our survey (represented by the red star in Figure 6) was at the campus side of the fence.  We followed the inside edge of the north wing of the building and walked until we reached the fence.  We figured this would be an easy place to identify on a map because the fence is right at a dramatic tree line.  The second location of our survey (represented by the yellow star in Figure 6) was on the north side of a picnic table and shelter.  We thought this would also be an easily visible feature on a map, but we found this somewhat difficult to find.  The third location of our survey (represented by the blue star in Figure 6) was in front of Governor's Hall.  We stood  right where the ramp ended in front of the main door.
Figure 6 - This is an aerial photograph of our study area.  The three colored stars are our specific positions we were in when acquiring distance and azimuth data.
The TruPulse Laser distance finder was being operated by one group member while another group member recorded the data (Figure 7).  This increased our efficiency and decreased the amount of time we needed to spend outside.
Firgure 7 - One page of data handwritten while in the field.

Importing the Data

     The first step was to find the approximate coordinates of where each of our locations were that we stood.  To do this, we looked at aerial imaging on Bing maps and put our cursor over our locations.  When taking note of these coordinates, we needed to take these numbers out to six decimal places.  This is a formatting issue in ArcMap that the previous class stumbled upon.  We used these coordinates in our Excel table along with other notes we took when we were in the field (Figure 8).  
Figure 8 - This is what our data looks like in Excel.  We made sure to note the feature,
 its azimuth, its distance, and some attribute about the feature.  These types of attributes differ what kind of feature it is.
In order to get the data to display in ArcMap, a few tools needed to be used.  First we used the "Bearing Distance to Line" tool, which is found in the "Data Management Tools" then the "Features" portion of the ArcToolbox (Figure 9).
Figure 9 - This figure is just showing how to navigate to the "Bearing Distance to Line" tool in ArcMap. 

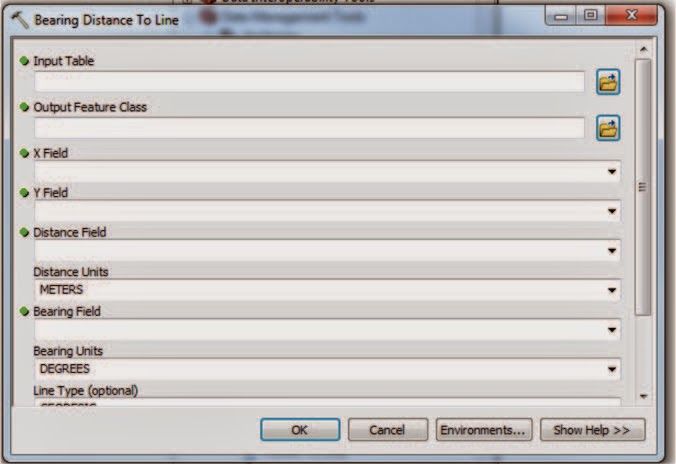
Figure 10 - This is the window that pops up when you click on the "Bearing Distance to Line" tool.  The Excel sheet that contains all the data is the input table.  The output feature class needs to be put in the geodatabase that was created earlier.  The X Field and Y Field correspond to the x and y coordinates in the Excel table.  The distance field corresponds to the distance away the features are to the observation point and the bearing field corresponds to the azimuth direction the feature is from the observation point.


Figure 11 - This figure shows how to navigate to the "Feature Vertices to Points" tool in ArcMap.

Figure 12 - This is the box that pops up when you open the "Feature Vertices to Points" tool.  The input features is the new feature class that was created with the "Bearing Distance to Line" tool.  The output will also go in the geodatabase that was created earlier.


Results

     Since we had three different locations that we took data from, we showed them in three different colors to see the data better (Figure 13).  We put imagery as a basemap in ArcMap to show where the data was in relation to real world locations.  Figure 13 is the result of running the "Bearing Distance to Lines" tool and the "Feature Verticies to Points" tool in ArcToolbox on the collected data.
     Most of our data looks like it turned out pretty well.  There are a few lines that do not look accurate because they go through buildings.  We only surveyed features outside, so this should not have appeared in the data.  The imagery available obviously does not include snow, which is a hindrance to see if our points were actually in the right spot all the time.  Some of the features we surveyed were snowmen, snow forts, and snow piles, which we won't be able to tell if they are in the right spot of not.
Figure 13 - This is the resulting map of the three locations we took the survey at.  The red points and lines represent data from the first location, the yellow points and lines represent data from the second location, and the blue points and lines represent data from the third location.


Conclusions

     There were a few points that ended up being mapped in a place that was not their true location.  This could be from our initial observation point that we chose on a map to get the coordinates for our three locations.  We could have been slightly off, getting different coordinates than where we actually were.  The materials that the buildings are made of could have also thrown off the device a little bit.  Since the snow was about 15 inches deep and the blustery conditions, it was difficult to conduct this kind of survey.  If the weather would have been different, I think we could have taken more points and had more attributes for each of the point data.  We could also have spent more time checking the differences between different instruments for collecting the data.  That way we could compare the equipment to see which device was more accurate for the survey.
     The exercise was a useful hands on experience to teach about more traditional methods of surveying.  We did not take any survey stations or even a GPS out to the field with us because we wanted an end product of  a survey using smaller more simple tools.  These methods may take longer to do than a piece of equipment that does it automatically, but now my group members and I are prepared to do a field survey if that equipment fails to work.  We do not have to blindly rely as heavily on our equipment to do the work for us, because we know how to take data with more traditional methods.

Feb 16, 2014

Unmanned Aerial System Mission Planning

Introduction

     To solve real life problems, you have to use logic and critical thinking in many different kinds of applications.  Simply thinking like a geographer can be difficult for some people, but it is a crucial part to solving important issues and disasters.  Unmanned aerial systems can assist with many spatial problems, and can help out tremendously when you need to see the whole view of the situation from an aerial view.  Unfortunately, these devices can be costly.  It is important to consider many options for solutions to a problem, especially when there is a tight budget involved and things need to get done in a timely and efficient way due to a time constraint.

Scenarios

Scenario One
Issue
     The problem is that the military’s ability to engage in conducting its training exercises at the military testing range are being hindered by the presence of desert tortoises. It is necessary for the military to be able to use their testing range without any disturbances.
I suggest that we use Unmanned Aerial Systems with a mounted sensor to monitor the testing range for the presence of desert tortoises so that the military will be able to conduct their training exercises without any disturbances.

Questions
     The first question is, how big is the study area? This is a very important question because different UAS (Unmanned Aerial System) devices have different flight times. For example, a gas powered UAS has a much longer flight time than an electric one. But electric is much more cost and eco-friendly, so if the area were smaller the preferred route would be to use an electric powered UAS. The problem with the area that needs to be covered should be apparent now.
     The second question is, is there a budget? The cost of UAS systems can vary significantly. Something such as a fixed wing copter can cost thousands of dollars. While it definitely has its advantages, if there is a low budget for the project this option would be out of the question. For lower budget projects there are options like a balloon or a kite that a sensor could be mounted to. These types of UAS devices can be as cheap as a hundred dollars. Another good thing about more primitive methods is that there is the option of building your own device. For every UAS there needs to a mount in order to attach the sensor to the UAS. Building your own is one way to cut down on the cost of your project. And if you mount your sensor to something like a kite or a balloon, the only significant cost would be the sensor itself.
In the description of this scenario it was stated that the military currently spends millions of dollars to rid their training facility of the tortoises, so I think it can be assumed that there is a fairly large budget for this project.

Solutions
     Because the questions above are something that cannot really be answered through this exercise, I will be presenting you with three different solutions to the tortoise problem. Before I can do this, there needs to be a base knowledge of the desert tortoise.
     The desert tortoise is a large herbivore that inhabits the Mojave and Sonoran deserts in the southwestern portion of America. The desert tortoise’s habitat is classified as follows; semi-arid grasslands, gravely desert washes, canyon bottoms, and rocky hillsides. Tortoises can be found near water and prefer drier soils for their burrows. The desert tortoise is able to live where ground temperatures may exceed 140 degrees F because of its ability to dig underground burrows to escape the heat. With this information about the desert tortoise we can conclude that within the area that needs to be surveyed, areas that contain water should be the first places to be surveyed. Also focusing on the soils that are being surveyed can be useful too. With remote sensing, drier soils have a higher reflectance. Once the survey is completed, the image can be studied, and where the soils are much brighter on the image shows the type of soil the desert tortoise prefers. Now if there is this soil with a high reflectance near water, that is where the tortoises are most likely going to be located.

** Attached to all of the UAS devices in each of our solutions would be a short-wave infrared sensor. This would enable us to see where the moisture content is in the soils. As it was explained before, the tortoises are going to be located in drier soils that are near water. With this sensor we would be able to see where the areas are that have that high reflectance (Drier soils) and find the drier soils that are closer to water sources.

Option One
     With the assumption that the area of study is large, we propose the use of a fixed wing, gas powered, UAS copter. The fixed wing copter can cover a larger area than a multi-armed copter would be able to. Think of the fixed wing as a plane and the multi-armed as a helicopter. To cover a larger area you would want to use a plane rather than a helicopter. The choice of using gas power over electric came down to two factors. First, the gas powered can run for longer periods of time, thus covering more area without having to come back and be re-powered. The second factor is the gas power may be more expensive than electric, but this budget for this project seems to be so large that the cost for the gas would be irrelevant.

Option Two
     Using a fixed wing, electric powered, UAS copter is the second solution to the problem. If the military wishes to take a more “green “approach to solving this problem, electric would be the way to go. It would be cheaper and better for the environment by now using up so much gasoline. The only problem with this method is that electric powered copters have a substantially shorter flight time. While gas powered copters can fly for about 10 hours straight, the electric can go for about an hour on a calm day. Depending on how large the area is, the electric powered copter would need to continuously keep returning to the base to be re-charged. This would increase the time it would take to survey the area of study.

Option Three
     Using a weather balloon or a kite in the third and final solution. This would be used if the area of study is smaller than we presumed and the initiative for this project is to go as “green” as possible. This solution would use no power source, so the only real cost would be to purchase the UAS equipment (or to make it yourself). The idea behind these is the sensor would be mounted to either the balloon or the kite and raised up into the sky to take aerial imagery. This method would not produce as good of images and may hinder the surveying process.

Cost
     The first UAS method mentioned was a fixed wing, gas powered copter. This type of UAS will cost you about $7,000. http://www.robotshop.com/en/cropcam-unmanned-aerial-vehicle-uav.html. The second UAS method mentioned was a fixed wing, electric powered copter. This type of UAS will run you about $1000. http://store.3drobotics.com/products/3DR-ARF-APM:Plane. The third UAS method mentioned was using either a balloon or a kite. A kite would cost you a little over one hundred dollars, while a balloon would cost you about $300. http://www.kapshop.com/Lifters-Balloons-&-Blimps/c75_32/p99/Balloon-150/product_info.html. These are without the sensors, and depending on how sophisticated of a sensor you attach to your device, it could cost you anywhere from $50 to $5000.

Purchasing one of the UAS devices mentioned about to take aerial imagery of the desires area of study would give you your most efficient way to locate the tortoise burrows. It would be much more cost effective than manually surveying the land for burrows. Depending on the route you wish to take for this project, one of the three methods mentioned above will be your best bet for effectively completing the project and giving you quality data as to conduct your research.

Scenario Two
Issue
     At the moment it would appear that the power company is being charged far too much for the services of a helicopter crew. These costs could be diminished significantly by utilizing unmanned aerial systems ranging from fixed wing devices to multi-armed copters. The costs per year could be redirected and lessened by owning a device. The initial cost would be higher, but the only costs afterwards are for maintenance and gas.

Solutions
Option One
     In the case of this power line issue it would be most advisable to purchase a multi-armed craft because of its maneuverability. The multi-armed copters are used to move and turn on a dime. They don’t have a long fly life time though, but they will be able to get the best image if the company is trying to get an accurate image of an area that needs to be fixed.

Option Two
     Helicopter rental costs are incredibly high and being able to find a helicopter near these towers could also be difficult. The power line company would save thousands of dollars by owning their own multi-armed copter because of the non-recurring costs other than gas and maintenance.

Option Three
     Another aspect to consider though with piloting a multi-armed copter is the danger that comes with it. These devices, piloted by inexperienced or reckless people, can cause death because of how the blades of the copters work. This could be a potential danger when coming close to power lines, however it also the best device to have for versatility. When looking at the dangers any company using the services of a helicopter must also consider the dangers of having employees lean out of the copter to take pictures.

Option Four
     Other plausible options that would be cheaper include, a kite with a camera attached to it, a weather balloon with a camera attached to it, and a fixed wing copter. There are a few issues with each of these other options, but they all have the potential of being less expensive. A kite could potentially not work if it got caught up in the lines and potentially ruin the cameras too. The weather balloon probably couldn't get the image that we needed to see a problem with the tower. The fixed wing copter is also a great option, however it won’t have the same maneuverability as the multi-armed copter.

Scenario Three
Initial Problem
     A pineapple plantation has about 8000 acres, and they want you to give them an idea of where they have vegetation that is not healthy, as well as help them out with when might be a good time to harvest.

Questions to Consider
     The initial question is always the budget.  More accurate information can be acquired based on how much you want to spend.  If the budget allows, the plantation could purchase its own unmanned aerial system to fly over the land that the pineapples are planted on to obtain how healthy the crops are doing.  A better sensor could be purchased to get more precise information about the pineapple plants.
     The way that the company farms the pineapples is important too.  The type of harvesting and when they are harvesting could have an impact on how well the plants do.  It is important to consider if irrigation is being used to water the plants, and what kind.  The type of soil that the pineapples are planted in could also affect their growth, because pineapples prefer light soils, but the use of pesticides and mulch may also have an impact on the fruits’ growth.  All of these factors could contribute to the output of quantity and quality of pineapples.

     A few different options should be considered when trying to see at a glance how healthy the pineapple crop is doing.  The following solutions are ordered from the least costly solution to the solution with the highest cost.

Solutions
Option One
     A hyperspectral sensor using the infrared band can be put on a weather balloon.  The infrared band is best for researching vegetation health.  The healthier the plants are, the brighter the red color will appear in the imagery.  The use of the balloon could save a lot of money.  They can travel fairly high in order to scope out the entirety of the plantation area and it can give a good idea of what is going on in the area in a short amount of time without having to search through a lot work.  This method is also extremely low on energy use.
           
Option Two
     The infrared band in a hyperspectral sensor is still the best option for sensors to see how healthy vegetation is.  An electric powered fixed wing copter may be a good option to get more accurate data compared to the balloon.  Running on electric power copter is a cheaper option than a gas powered copter.  The flight time would not be as long, but it may be more cost effective for the company to bring it down and charge it if the copter cannot survey the area in one flight.

Option Three
     The same kind of hyperspectral sensor with the infrared band should still be used, but for this option, a gas powered fixed wing copter could be used to scan the pineapple crops.  This way, the copter could be in the air longer and get more detailed information about the plants. Since the craft is able to stay in the air longer, it could fly closer to the ground and get more accurate information about the pineapples’ health conditions.

Scenario Four
Issue
     It would appear that the greatest need for this oil company is stop the leak so as to not lose any more of their potential profit. The surrounding community is in great need for this leak to get fixed as well since the oil is spilling into their water resource. I would place this issue at high demand since it is affecting the lives and wellbeing of those that live near the Niger river delta. Fortunately for these people it is in the best interest of our client to also find and fix this leak in the pipeline. There are several ways to quickly and efficiently solve this problem and future issues along the pipeline as well.
     Some background information about the Niger River delta is important in understanding just how to best go about giving a valid solution to this problem. For instance, the delta is 53,000 sq./km and the river itself is a natural source of irrigation, drinking water and bathing source for both people and animals. There are over 200 different species of fish living within the delta and it is considered a crossroads for two differing habitats of fish. While the river is already very polluted by human contact, the entrance of oil directly into the delta is bad for both aquatic life and the livelihood of farmers.
            
Solutions
Option One
     Several options were discussed by a team of professionals and two main options were devised with the addition of several others depending on the oil company’s needs. The top two ideas that were created were a weather balloon with a camera attached to it for cost efficiency or a multi-armed rotary copter for maneuverability efficiency. A weather balloon would be a low cost item to attach a camera to in order to find the source of the leak. The only real issue with a balloon is the ability to control it if you do find a region of leak.

Option Two
     The other option of either a fixed wing or multi-armed copter could also work. The device itself would cost a lot more money but the ability to maneuver would be paramount in the search for the leaking pipe. There are two types of models to consider: a gas powered copter used for long time lapses or an electric for cost, but less air time. Both of these machines provide a higher source of maneuverability than a balloon but will be much more expensive. When all is said and done, a budget would grant the team a better clue at how much would be viable to spend on the mission.
            
Option Three
     Depending on whether or not the company wants to do additional research on the affects that this leak made on their surroundings a sensor would be suggested in order to do research on the health of the vegetation in the region. This could also be important for future research as well since they could track the health of the vegetation around the pipelines. A sensor would be needed to add to one of the devices, most likely a copter.

Additional Options
     Some additional options to consider include the use of a rocket with a camera attached and maybe even the use of a kite. A rocket could be a fun venture for the company but it could be a boom or bust situation, which seems like a bad idea since the spill could be affecting both animals and people. The other option of a kite could be a failure as well if there is no wind present or if the area to search is too large, which in this case, it most likely is.

Scenario Five
Initial Problem
     A mining company wants to get a better idea of the volume they remove each week. They don’t have the money for LiDAR, but want to engage in 3D analysis.

Questions to Consider
     The most important question is to ask what the budget is for the mining company.  The company could get better information about the volume extracted from their mine depending on methods used to collect data.  The economy has a large impact on whether or not the mine can even be active, so surveying methods costs need to be low.
     One factor that could hinder a volume calculation is if the mine is continuously productive or if they have periods of time when productivity is stagnant.  An accurate reading cannot be given for a distinct period of time if the mine is not constantly producing resources.  It is also important to consider what kind of mine it is and how large the mining area is.


     A few different options should be considered when trying to see at a glance how much the mine is extracting from the land.  The following solutions are ordered from the least costly solution to the solution with the highest cost.

Solutions
Option One
     A kite could be flown over the mine with cheap imaging sensors.  This would be the most cost efficient option because the area of interest is not very large and the materials for a kite are very cheap.  Point cloud software based sensors could be used on the kite.  The software collects survey points and creates 3D surfaces by connecting the points.  Ground control points would assist in accuracy and keeping low costs at the same time.

Option Two
     The mining company can use other cheaper software and sensors that create 3D point clouds.  These kinds of sensors can be put on any kind of aircraft.  To save money, it may be wise to use an electric powered fixed wing aircraft to fly over the mine rather than a rotary craft.  That way, you can fly the craft over strips of land one section at a time.  Flying the craft parallel to the strip of land that was previously scanned will allow the sensors to collect sets of data from the same point on the terrain.  True x, y, and z data can be interpolated from this parallax of a single point from different aerial angles.  Using an electric powered craft is a cheaper option than a gas powered one.  It does not have as long of a flight time, but probably would not need to be very long because the mine pits do not extend over a very large amount of area.

Option Three
     If it is possible to get more funding, it would be worth getting access to LiDAR data for the area of the mine.  This could also be accessible through county data if they could have access to it.  They would need to sort through the tiles of the county LiDAR data to find where their mine land would be.  This process may be monetarily costly as well as costly with time, but it would be worth having this kind of data.  LiDAR data can be processed in ArcGIS to estimate where the land surface once was and run a model to see how much land mass has been removed from the mine pit.

Feb 9, 2014

Visualizing and Refining Terrain Survey

Introduction

     This is technically part two of the previous exercise, so we were with the same group members as in Assignment One.  We are now looking at the data we have collected from our "field work" in a digital medium. With the data we collected, we can run different types of interpolation methods in ArcGIS.  Based on how the models turn out, the groups assessed whether they needed to revisit any areas of their terrain to acquire more accurate data.

Methods

     Our Excel spreadsheet has three separate columns for x, y, and z coordinates which can easily be imported into ArcGIS.  We were required to run at least five different kinds of interpolation methods.  Every method has a different way of acquiring values for each cell and each methods can have a different purpose.  It all depends on what the analysis is about and what you are trying to look at.

IDW (Inverse Distance Weighted)

     This kind of interpolation method estimates the value for each cell by averaging the values of points of data in neighborhood of each processing cell.  If a point is closer to the center of the cell, the greater the influence it has on the overall average.   
2-D terrain using IDW interpolation method in ArcMap.

3-D terrain using the IDW interpolation method in ArcScene.

Natural Neighbors

     The natural neighbor interpolation method finds the closest sequential values to the point and applies a weight to it based on proportionate areas.  It can also be called Sibson or "area stealing" interpolation (Sibson, 1981) (ArcGIS Resources, 2012).
2-D terrain using the natural neighbors interpolation method in ArcMap.
3-D terrain using natural neighbors interpolation method in ArcScene.

Kriging

     A geostatistical  method known as kriging estimates the surface from a set of scattered points that contain z values.  With any interpolation method, one should take care to do thorough attention towards the z values and their spatial behavior.
2-D terrain using the kriging interpolation method in ArcMap.

3-D terrain using kriging interpolation method in ArcScene

Spline

     The interpolation method that uses spline estimates values using a mathematical function that essentially lowers the amount of curvature the overall surface has while going through all the input points, and gives a smoother surface as a result.

2-D terrain using the spline interpolation method in ArcMap
3-D terrain using spline interpolation method in ArcScene.


TIN (Triangular Irregular Surface)

     This method creates triangles by connecting three of the points of data.  The plane of that triangle takes into account the x, y, and z coordinates, and therefore adjusts itself at the proper angle for modelling the elevation.
2-D terrain using TIN interpolation method in ArcMap.
3-D terrain using TIN interpolation method in ArcScene

Discussion

     I think our results turned out pretty well from when we did measurements the first time around.  The very first time our group went outside to assess our area and our terrain, we had decided to be very accurate with our coordinate system.  Because we had marked off 5 cm increments for both the longitude and latitude of our plant box, we were able to acquire precise data the first time 
     Natural neighbor seemed to be the best representation of our terrain.  It is not choppy, yet it does not oversimplify things by smoothing everything over.  You can clearly see where we tried to build sharp features compared to gradual ones; other methods do not show this as well.  It was insightful to see all five methods and compare them to each other.

Conclusion

     The geography part of my education was a positive after though as I was working through my comprehensive geology degree.  One important lesson they teach their students when doing field work is to do a good job the first time, because there is no time to go back to an area to acquire more data later.  If you are in a professional situation, you cannot afford to be just ok when you do field work.  When people depend on you, they will not settle for data that is not accurate enough.  Besides that, usually deadlines are restricting your time frame for data collecting. 

Creating a Digital Elevation Surface

Introduction

A general map of the University of Wisconsin-Eau Claire campus.  The red
star shows approximately where our plant box is.  (Google Maps, 2014)
     This exercise provided a great way to break into geospatial thinking.  While other classes have cookie cutter directions that a monkey could do, this class requires critical thinking to create our own steps to figure out problems.  Each group in this first assignment was allocated one flower box in the courtyard of Phillips Science Hall with dimensions of about 235 cm long by 110 cm wide to create a terrain.  The requirements were to have a hill, valley, ridge, plain, and a depression in our terrain somewhere within our given space.  It did not matter where they were in the box or in relation to one another and it did not matter how large or small they were.  The groups were required to determine a sea level point (zero elevation) in our designated area.  Next, the groups needed to come up with some sort of coordinate system for the designated area.  The coordinate system is arbitrary and does not need to correspond to true north in the real world.
Google Earth imagery of Phillips Science Hall.  The red star shows approximately where our plant box is.
I was part of group three along with Zachary Howard, Jeremy Huhnstock, Blake Johnson, and Cody Kroening and we built our terrain and conducting our surveying of that terrain on January 29, 2014.

Methods

Jeremy and Cody building a
mountain.
     An infinite number of paths could have been chosen for how to complete this project.  Our group decided to have the top edge of the plant box to be our sea level (elevation of zero). One of the first things we noticed in our plant box was a large chunk of soil protruding upwards towards one of the ends of our plant box.  We decided that we would put our ridge there, so we would not have to worry about digging out this frozen soil.  Other than that spot, we smoothed over our terrain with a large wooden board, which allowed all of our building to start at our zero elevation level.  In hopes to make our three-dimensional digital models of the terrain to really stand out, we wanted to create a dramatic landscape.  To fulfill this goal, we built above the line that marked the edge of the flower bed, and we dug into the snow that filled it up.  We wanted to make our terrain unique, so we made a three step terrace, making the deepest one down to the soil, without having to dig any out.  This feature marks our series of river valleys.  Another aspect making our terrain unique was our idea of putting the depression feature above our sea level plane.  We built up a large mountain feature towards the middle of our allotted area, then formed a depression in that mountain, making it look like a caldera. Beyond the mountain is where the plain and the hill reside.  Below are two pictures that show a view of our terrain from each end of the plant box.

     For our coordinate system, we decided to mark off each direction by increments of 5 centimeters.  To do this we simply held a tape measure across the edges of the plant box and marked off each increments directly on the wooden box with a sharpie.  Those measurements became our x and y coordinates.  At each coordinate, we then took a measurement of the elevation at that point, creating the z coordinate.  To take these measurements in the more simple areas, it was sufficient enough to hold up a meter stick and approximate where our elevation level was.  As we worked our way across our terrain, the complexity grew.  We needed to change our technique in order to get more accurate readings of the z value.  To do this, one person held a meter stick perpendicular to "ground surface" and another person held a meter stick parallel to the ground surface at the correct height corresponding to that features' elevation about zero.  Another person read off the measurement from the first meter stick to ensure that each person could concentrate on holding their meter sticks straight and in the correct place.  The photo below can help illustrate how we did this.
More accurate way of measuring the complicated terrain.

Discussion

     We started the day with very ambitious intentions.  Our caldera feature was very high above our zero elevation level, which we wanted in order to show interesting digital models later.  We hadn't realized how difficult it would be to measure this kind of feature given the tools we had to do it.  This was especially true for the depression feature in the mountain/caldera.  Our methods did work, but things would have been easier given a more simplistic terrain.  Given a minimal amount of tools, I think our group took useful survey data.

Conclusion

Rite in the Rain field notebook to record data before we acquired a lap top.
     After spending five hours outside in the Wisconsin winter weather, we had over 1000 points of data for the terrain we had built in a 110 cm x 235 cm plant box.  We had a large range of elevation data collect, the lowest elevation being 17 cm below our sea level, and the highest elevation at 37 cm above our sea level.  The next step is to ensure all of our data is in an Excel spreadsheet then import it into ArcGIS.  From there, we can run different kinds of terrain analysis on the data.