Introduction
In this Geospatial Field Methods course, we have learned a variety of surveying techniques that require very minimal equipment. In this exercise, we used a high end piece of equipment to survey the campus mall area at the University of Wisconsin-Eau Claire. The Topcon Total Survey Station along side the GMS-2 handheld GPS system gives a much higher accuracy of X, Y, and Z coordinates. With previous methods of surveying, elevation values (Z coordinates) could not be acquired. We spent one entire class period learning how to set up the Topcon Total Survey Station in the classroom setting. This is a very expensive piece of equipment, so we were all required to know the steps in just setting up the station before actually putting it into use. Even with preparation, groups ran into a few issues when executing this survey activity.
Methods
Setting up the Topcon Total Survey Station properly is almost more important than performing the survey. The tripod that the Topcon sits on top of has three legs that need to be spread wide enough that the whole device will not tip over (Figure One). Once the legs of the tripod are evenly spaced, one person should step on the small ledge near the bottom of each leg and push it down into the ground to ensure stability of the station. The tripod should also be made as level as possible before even attaching the Topcon to it. This can be done by adjusting each of the telescoping legs of the tripod. Now the Topcon can be attached to the top of the tripod. A piece on the bottom of the Topcon needs to be unscrewed before placing it on top of the tripod. This piece gets screwed back on the bottom of the Topcon, but this time through the tripod. This ensures that the Topcon will stay atop the tripod while conducting the surveying exercise. There are a few levelers on the Topcon that assist in making the system completely horizontal. The telescoping legs should be adjusted on the tripod as needed to get the Topcon level. Additional air bubble levelers should viewed while turning the four round black nobs that the Topcon sits on, to get the system more precisely level. The height from the ground up to the lens of the Total Station should be noted as it will need to be put into the GMS-2.
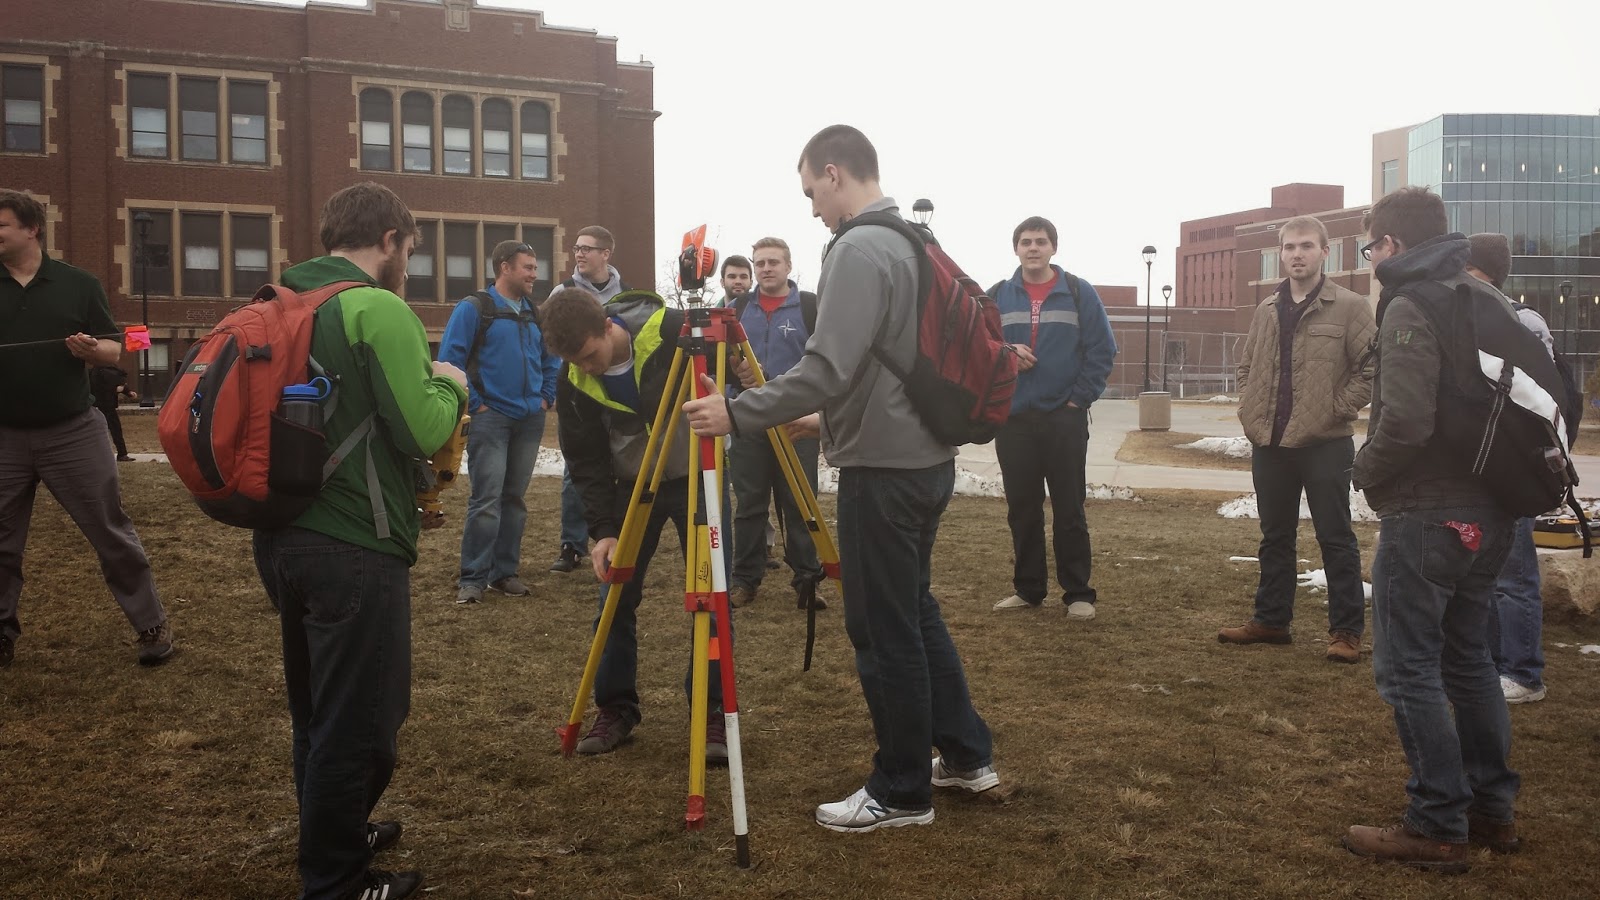 |
| Figure One - Drew and Tanner are setting up the base for the Topcon Total Survey Station during the class's initial day learning how to set up the equipment. |
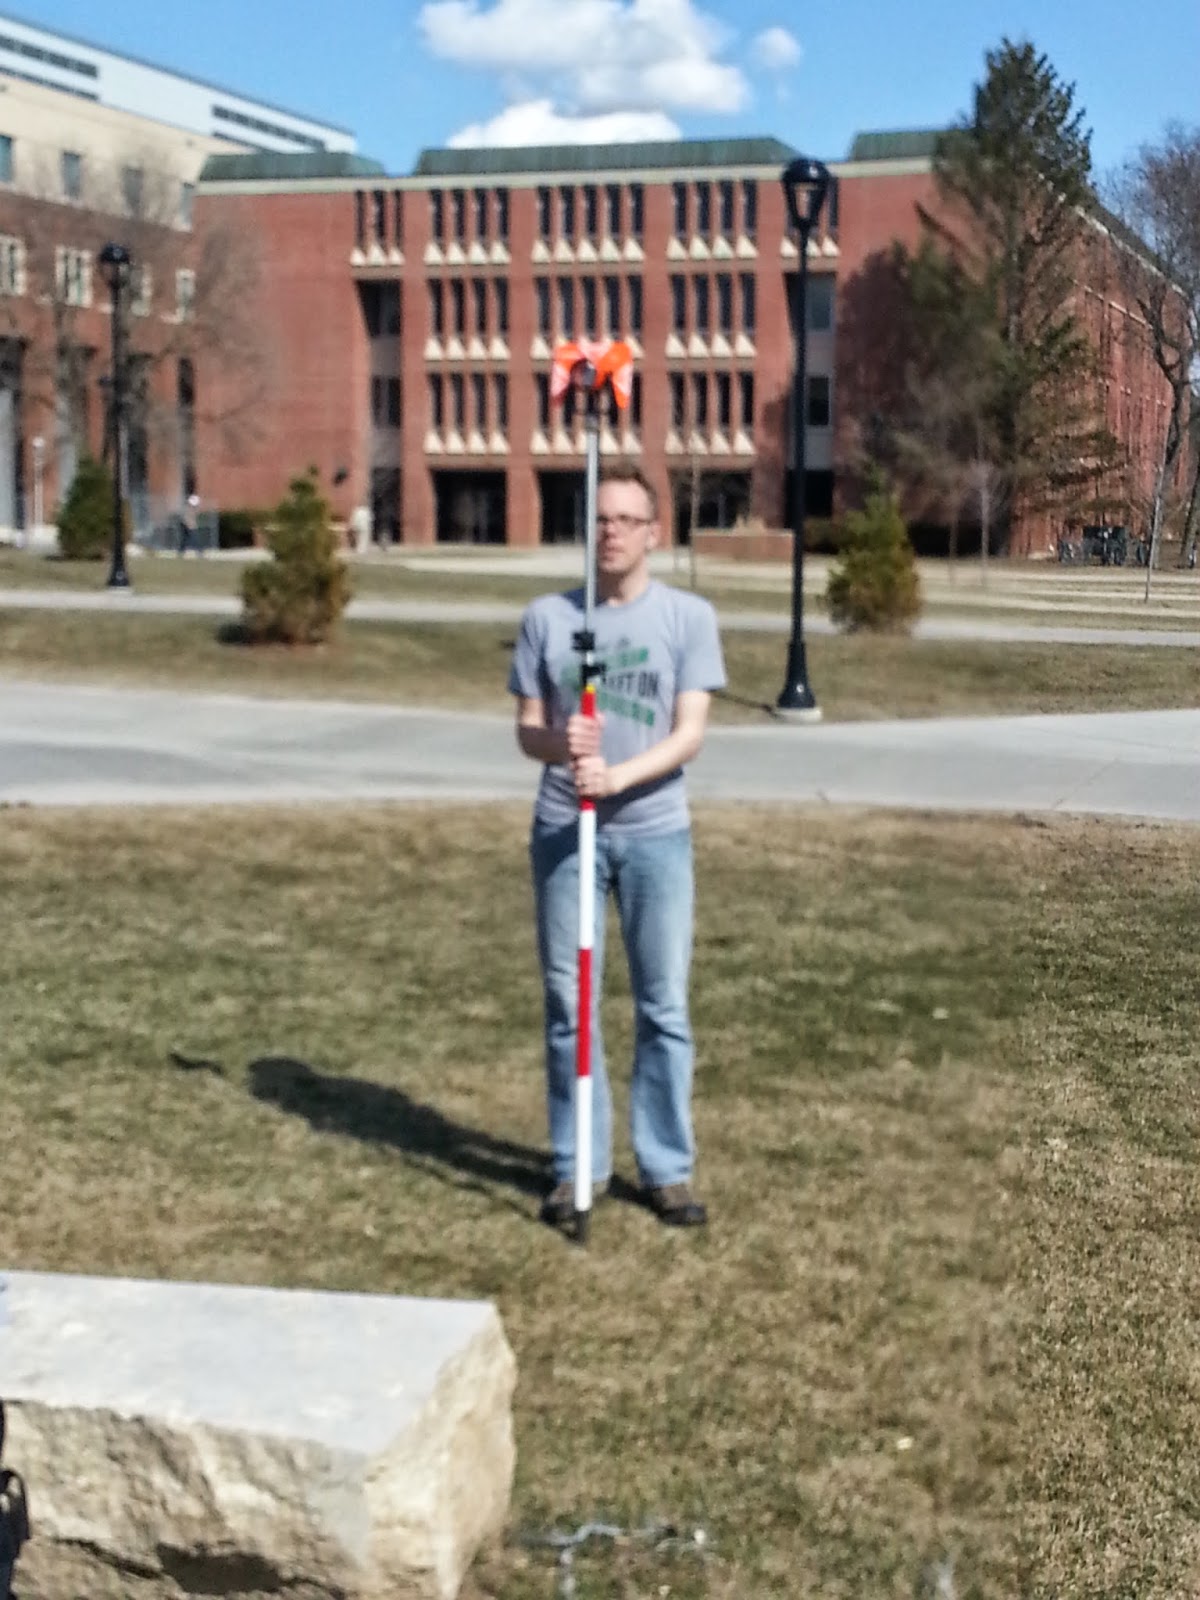
Once the Topcon Total Station is set up and leveled, the cover must be taken off of the front lens and the system can be powered on with the green power button on the system. The tilt should be checked to make sure the whole station is not too far away from being level. The laser plummet should also be used to check if the center of the station is over the point that you want it to be. This is denoted with a star on the Total Station. If the station is centered over the desired point, then the blutooth needs to be turned on with the Total Station (Menu--> F4 --> F4 --> F2 --> F4 --> F4 --> F3 --> "Enter" to set). Using the handheld GMS-2 device (Figure Two) now, the project needs to be selected. The software program used for this is called "Topsurv" and it should recognize the blutooth of the Total Station. Then the occupied point and the backsite need to be set up on the Total Station. In the "collect" menu, chose "OCC/BS setup." Have one person in your group stand at a location and shoot it with the Total Station. Use a conventional compass to find the azimuth of that point and record that in the handheld GMS-2 device. Do the same for the backsite. This is the step that will ask for the height of the Total Station as well as the height for the reflector. For our survey, the azimuth for our backsite was 322,º the height of the Total Station was 1.52 meters, and the height for the reflector was 2 meters.
 |
| Figure Two - A look at the GMS-2 handheld piece of equipment that goes along with the Topcon Total Survey Station. |
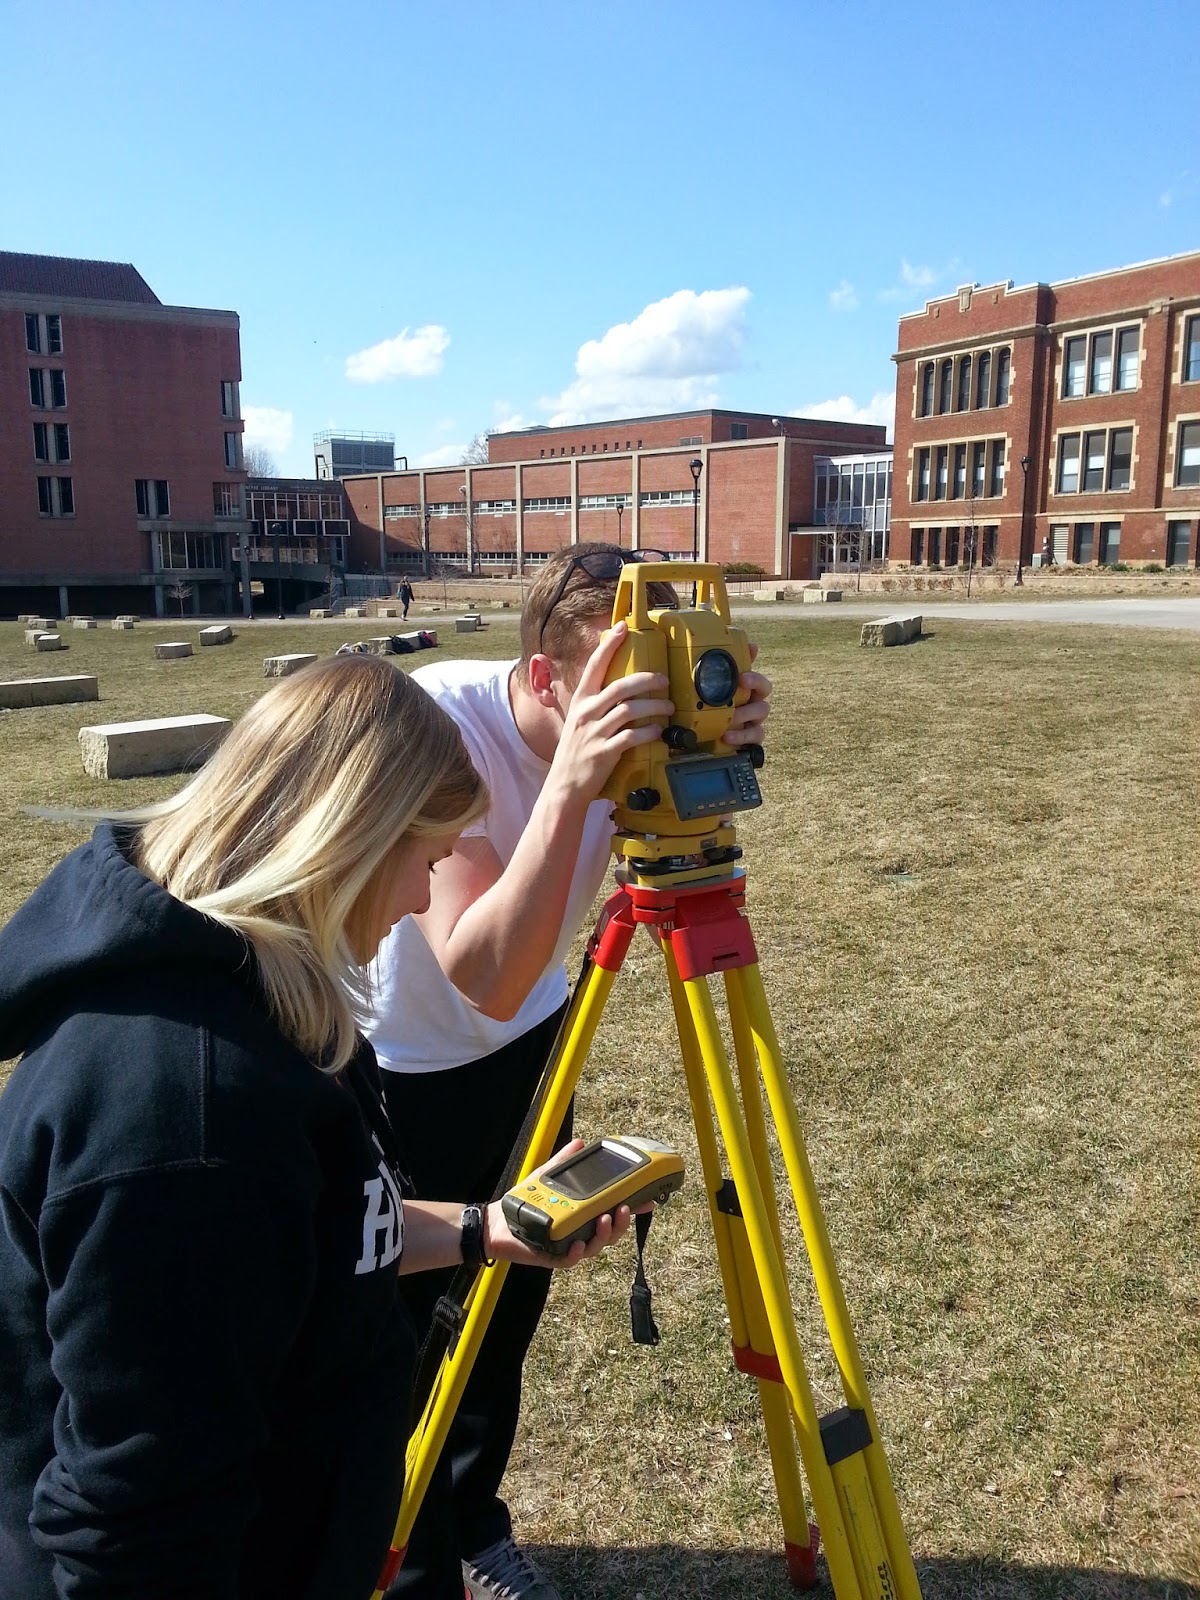
Now the data collecting can begin! In the main menu of the Topsurv software, go to collect, then select topo, then measure. One person in the group needs to stand at the survey point with the reflector that is on a pole at a fixed height throughout the survey (Figure Three). Another person needs to peer through the Total Stations scope towards the reflector. Once they have it sited, the third person clicks collect on the GMS-2 (Figure Four). The Total Station recognizes the azimuth and the elevation of the location of the reflector relative to itself based on information from the set occupied point. Our surveying group took 116 points and tried to take them in a somewhat systematic way. We started on the west side of our mapping area and tried to make 8 step intervals between each collection point. Each row of data we collected trending north-south, and each row was progressed west to east. By having this methodology in collecting the data, I believe we got a decent coverage of the area of interest.
 |
| Figure Three - Nate is poses with the reflector, showing that you need to stand perfectly still in order for the person manning the Total Station to shoot it with a laser. |
 |
| Figure Four - Blake operates where the measurement is going to be taken with the Total Station while I operate the GMS-2. |
Once all the data points were collected, they needed to be exported from the the GMS-2 to a computer. To do this, go to the "Export" menu and chose "To File." The data can be exported as a .txt and a .shp, but the projection and the datum need to be the same as what the data was collected in. Also, the delimiter needs to be set to comma. The data was able to be opened in Notepad and then exported as a table that could be opened up in Excel. We did this just to make sure the data was exported in the correct format. From here, the table can be added to ArcMap and the X and Y data can be displayed with the elevation data attached to it. To interpolate what the elevation would be in the area between the points, a kriging method was used. This creates a continuous surface with a pretty good idea of what the elevation is across the area of interest.
Results
Our group took 116 points across the new campus mall area (Map shown in Figure Five). We realized that some of our points are more bunched together than other points. If we would have exactly measured out where each point was going to be, our points may have been more evenly distributed. This may have also been the case because each group member switched roles throughout the survey, so that everyone would get hands on experience with all pieces of the equipment. This means that different people were pacing out the distance between each point during the survey. For example, Blake is taller than I am, so he is likely to have bigger strides than when I was holding the reflector. Having said that, our methodology worked well for getting a relatively quick survey of an area.
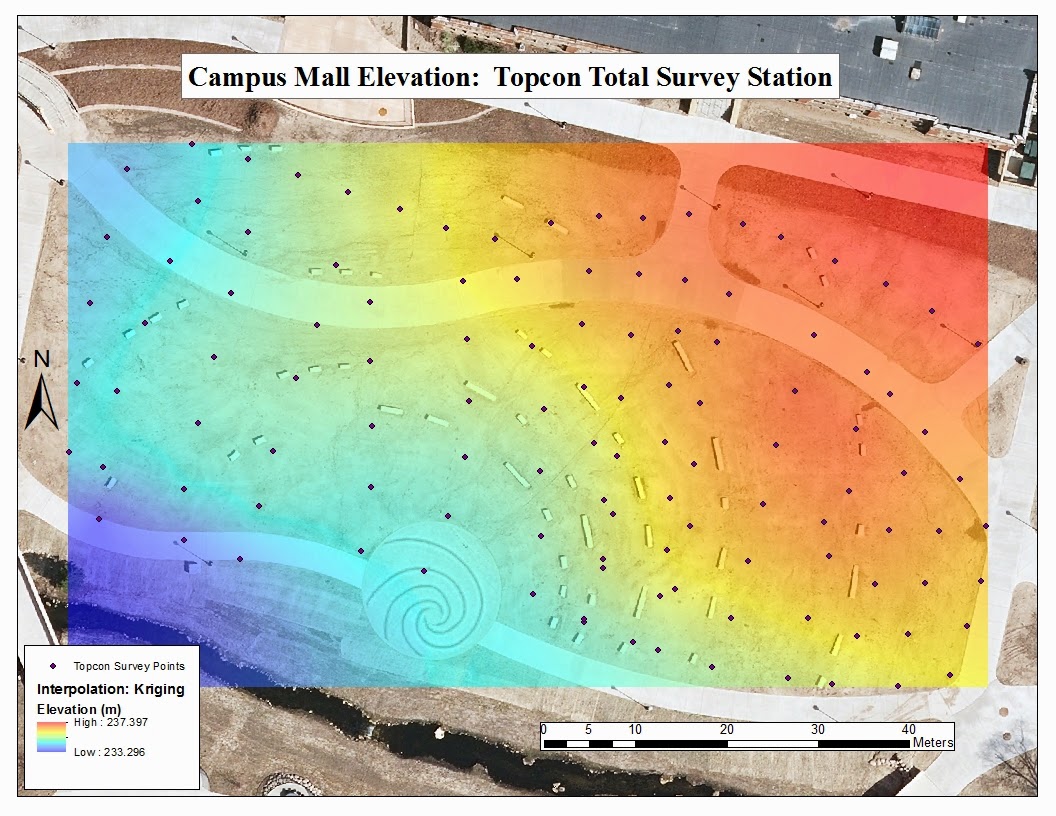 |
| Figure Five - This is resulting map of our surveying using the Topcon Total Survey Station. Each individual survey point is shown as well as the relative elevation based on the interpolation method of kriging. The elevation change is not very great across our area of interest, so the color spectrum from the interpolation may make the elevation differences seem larger. The background image was collected when LiDAR data was collected from May 13, 2013. |
Discussion
While executing this survey, our group encountered a multitude of problems. When we were setting up our occupied point, the "HTC Set" button would not click on our handheld unit. After many attempts of clicking, the system would tell us that the bluetooth needed to be reconnected. This happened many times while this "HTC Set" would not click. Somewhere within this process, the Topcon Total Station shut down and we had to reboot it. When the system rebooted, the handheld unit then allowed us to click the "HTC Set" without being interrupted by a bluetooth warning. After the whole system rebooted, the bluetooth warning did not return for the rest of the exercise.
When looking to start collecting points, our group had a hard time finding which menu to go into to actually collect the points. The directions only said to go to "col" menu and go into the observations tab, but what we really had to do was go into "topo" menu and from there navigate to the "measurement" option. From there on out, our data collection seemed to go smooth.
Exporting the data we collected in the field also had an unexpected snag. We exported the data from the GMS-2 as a text file (.txt) and as a shapefile (.shp). When opening either file type in their appropriate programs, only the occupied point showed up. The GMS-2 system appeared to have been collecting data, but that data was not exporting into the data files. I believe this might have something to do with when the Topcon Total Station rebooted itself when we were attempting to set our occupied point. The GISP at UW-Eau Claire, Martin Goettl, was nice enough to recompute our data to show up.
Conclusions
Getting hands on experience with the Topcon Total Survey Station was a very useful exercise. Using any sort of equipment for the first time will always have its problems and downfalls. I only wish there was more time to maybe take the equipment out to another location and survey areas outside of our UW-Eau Claire campus. I think it was a good idea for us to learn how to set up the Total Station before going out to collect the data. This probably eliminated a lot of the errors that could have been present. This surveying process definitely requires at least two people, but having three people per team allowed each member to really focus in on their specific task. Conventional survey methods are great to know, but using this kind of equipment to conduct a survey allows for much more accurate data, which is always a plus.
No comments:
Post a Comment